

Allegiant Air - Strategic Analysis and Outlook Report 2026 (Updated)

Dear Readers, Welcome to AviationOutlook.
Let’s analyze the topic in detail.
Executive Summary
Allegiant Travel Company closed the largest transaction in its history on May 13, 2026 with the completion of its acquisition of Sun Country Airlines, forming a roughly 195-aircraft leisure-focused carrier serving more than 650 routes and approximately 22 million annual customers.
The company posted record first-quarter 2026 results, with total operating revenue of $732.4 million, GAAP diluted EPS of $2.30 and an adjusted airline-only operating margin of 14.9%, while TRASM jumped 16.4% on a 5.9% capacity contraction.
The fleet plan keeps the 71-aircraft Airbus A320 backbone steady through 2026 while ramping Boeing 737 MAX 8-200s from 17 units at Q1 2026 to 25 units by year-end, with 34 MAX deliveries remaining from the 50-jet 2022 order and 80 options stacked behind it.
Management is now guiding to full-year 2026 adjusted EPS of more than $8, a roughly 60% year-over-year improvement, while targeting $140 million in run-rate synergies from the Sun Country combination within three years of close.
Recommended - Read Full Reports


Read All Reports
Table of Contents
Executive Summary
Allegiant Company Profile: Key Facts
Allegiant Revenue & Financial Analysis
Full-Year 2025 Financial Performance
First Quarter 2026 Results: A Record Opening
Q2 2026 Guidance and 2026 Outlook
Revenue Growth Drivers
Key Services and Products
Sunseeker Resort Divestiture
Allegiant Fleet Analysis
Fleet Size and Composition
Fleet Age and Configuration
Fleet Strategy: From Airbus to a Boeing-First Future
Sun Country Fleet Integration
Allegiant Route Network Strategy and Major Destinations
The Underserved Small-City Strategy
2026 Network Expansion: 30 New Nonstop Routes
Major Destinations and Leisure Anchors
Sun Country Integration and International Expansion
Network Optimization in 2026
Major Operational Bases (Hubs)
Las Vegas Headquarters and Primary Base
Florida Base Cluster
Northern and Midwestern Bases
Base Closures and Optimization
Allegiant Competitive Position
Major Competitors
Allegiant vs. Frontier Airlines
Allegiant vs. Breeze Airways
Allegiant vs. Sun Country (Pre-Merger Context)
Allegiant vs. Southwest Airlines
Sun Country Acquisition: Strategic Implications
Deal Structure and Terms
Synergy Targets and Strategic Rationale
Integration Timeline
Labor and Workforce Considerations
Pilot Representation
Workforce Scale
Key Risks
Risk 1
Risk 2
Risk 3
Risk 4
Risk 5
Risk 6
Risk 7
Risk 8
Technology Modernization and Commercial Initiatives
Sustainability and ESG Considerations
Customer Experience and Brand Positioning
Capital Allocation Framework
Outlook for 2026 and Beyond
My Final Thoughts
Official Sources & Data
Allegiant Company Profile: Key Facts
Allegiant Air operates as the wholly owned subsidiary of Allegiant Travel Company, a Las Vegas-based integrated travel company.
The carrier has operated as a public company since 2006 and traces its origins back to a small operation founded in 1997.
The airline’s identity is built around a single, focused premise: serving leisure travelers from small and mid-sized U.S. cities with all-nonstop service to vacation destinations.
This positioning differentiates Allegiant from the larger ultra-low-cost carriers that chase volume in major metropolitan markets.
Legal Parent       : Allegiant Travel Company (NASDAQ: ALGT)
Operating Airline  : Allegiant Air, LLC
Headquarters       : Las Vegas, Nevada
Founded            : 1997
IPO Year           : 2006
CEO                : Gregory C. Anderson
President & CFO    : Robert Neal
Business Model     : Ultra-low-cost leisure carrier
Fleet Size (Q1'26) : ~123 aircraft (Allegiant standalone)
Combined Fleet     : ~195 aircraft (incl. Sun Country, post-close)
Cities Served      : ~175 (combined entity)
Routes             : 650+ (combined entity)
Latest Milestone : Completed Sun Country acquisition May 13, 2026Leadership transitions accompanied the merger.
Gregory C. Anderson, who already served as CEO of Allegiant, retained that role for the combined entity, while Robert Neal stepped into the joint President and CFO position.
Three new directors joined the Allegiant board following the Sun Country deal close, including Sun Country’s former CEO Jude Bricker, Jennifer Vogel, and Thomas C. Kennedy.
Allegiant Revenue & Financial Analysis
Full-Year 2025 Financial Performance
The full-year 2025 report was the cleanest financial year Allegiant has produced since the pandemic.
Total operating revenue reached $2.6 billion, up 3.7% year-over-year, with the airline-only segment delivering $2.5 billion of that total, a 4.3% improvement.
The bottom line was still negative on a GAAP basis, with a net loss of $44.7 million, but this represented an 81.4% improvement versus the $240.2 million loss recorded the previous year.
The remaining drag continued to come from Sunseeker Resort impairments and merger-related charges.
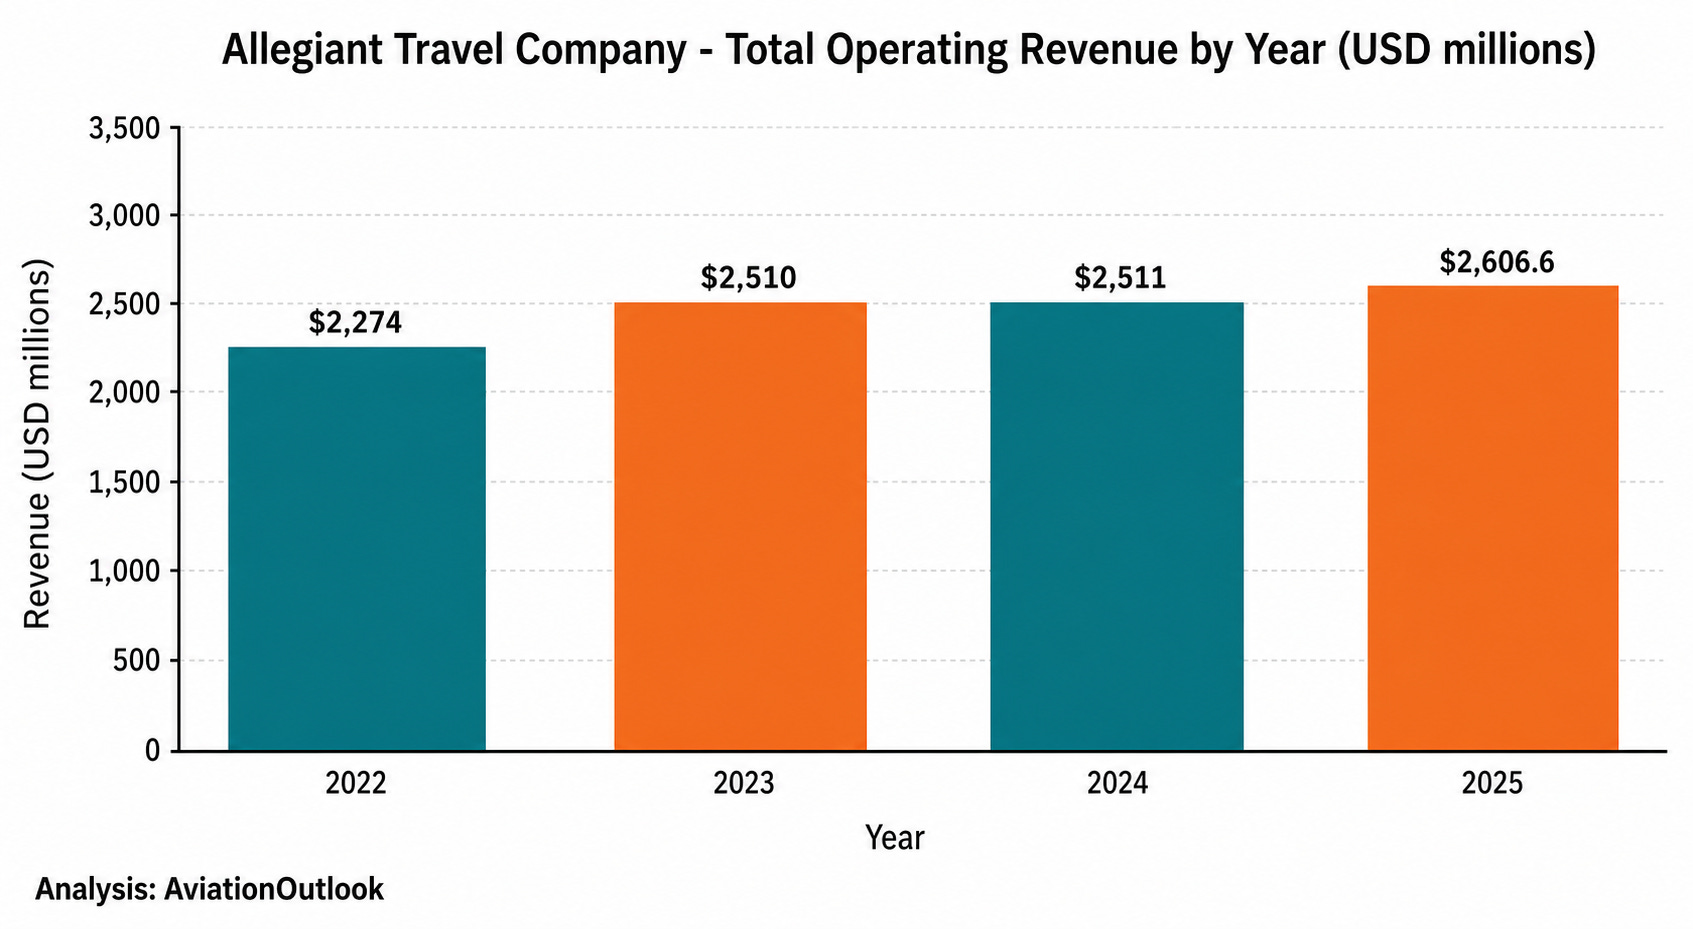
Image source: AviationOutlook analysis. (Chart shows Allegiant Travel Company total operating revenue across fiscal years 2022 through 2025, reflecting steady recovery and growth driven by ancillary fare expansion and fleet modernization.)
Capacity for the full year came in at 21.4 billion available seat miles, with a load factor of 82.0% and a record total average ancillary fare of $76.35 per passenger.
The ancillary line continues to be the single most important value driver in Allegiant’s commercial mix.
Operating cash flow reached approximately $389.8 million for fiscal 2025, supporting the company’s ability to fund ongoing Boeing 737 MAX deliveries while preparing the balance sheet for the Sun Country transaction.

First Quarter 2026 Results: A Record Opening
The first quarter of 2026 was a clear inflection point.
Allegiant reported record quarterly operating revenue of $732.4 million, a 4.8% increase against Q1 2025’s $699.1 million.
Net income reached $42.5 million, translating to GAAP diluted earnings per share of $2.30, while adjusted diluted EPS came in at $3.77, a 78.7% jump versus the same quarter a year earlier.
The result was achieved on a lower capacity, which is the signature characteristic of a carrier executing a disciplined yield strategy.
ALLEGIANT Q1 2026 SUMMARY
-------------------------
Total Operating Revenue        : $732.4 million
Net Income                     : $42.5 million
GAAP Diluted EPS               : $2.30
Adjusted Diluted EPS           : $3.77 (+78.7% YoY)
Adj. Airline Operating Margin  : 14.9%
TRASM Change                   : +16.4% YoY
CASM Change                    : +14.0% YoY
System Capacity (ASMs)         : Down 5.9% YoY
Load Factor                    : 84.4%
Controllable Completion Factor : 99.9%+
The standout metric was total revenue per available seat mile, which climbed 16.4% as Allegiant pulled back unprofitable capacity and concentrated flying on peak leisure days and high-demand markets.
Cost per ASM rose 14.0%, reflecting both lower spread of fixed costs across fewer flights and elevated maintenance expense, but the revenue gains comfortably outpaced the cost pressure.
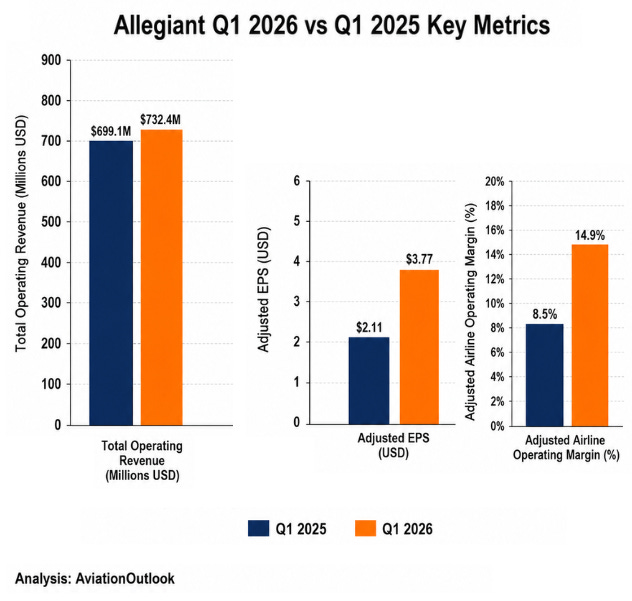
Image source: AviationOutlook analysis. (Side-by-side comparison of Allegiant Travel Company’s three most important first-quarter metrics across 2025 and 2026, showing the magnitude of operating margin expansion and EPS growth.)
Q2 2026 Guidance and 2026 Outlook
For the second quarter of 2026, management took a cautious tone. The company guided to a capacity reduction of approximately 6.5%, citing rising fuel costs and the integration workload tied to the Sun Country acquisition.
Despite the near-term softness in capacity, the full-year framework remains constructive. Allegiant continues to point toward adjusted EPS of more than $8 for 2026, which would represent a roughly 60% year-over-year increase.
The composition of earnings growth is what you should focus on.
The contribution stack now includes maturation of the 737 MAX fleet, the rollout of Allegiant Extra premium seating, and ongoing technology modernization that improves merchandising and revenue management.
Allegiant Revenue Growth Drivers
The most powerful structural driver remains ancillary revenue.
The full-year 2025 average ancillary fare of $76.35 per passenger places Allegiant near the top of the U.S. industry on a per-passenger basis, and the trajectory has been positive for several years running.
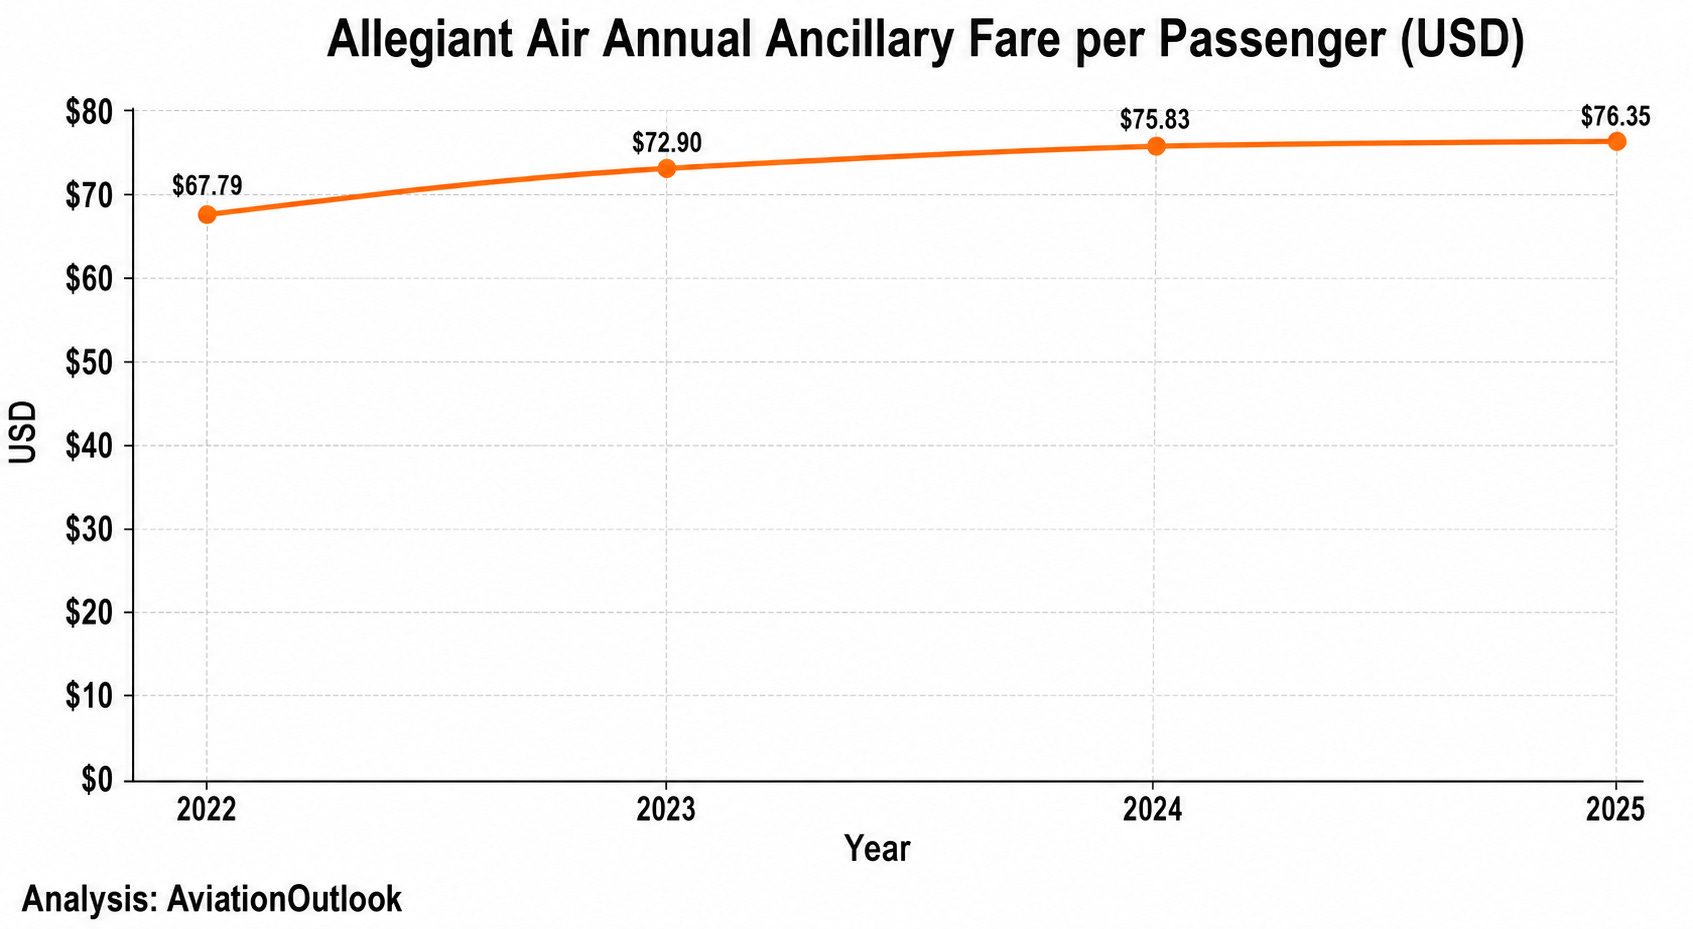
Image source: AviationOutlook analysis. (The chart tracks Allegiant’s average ancillary fare per passenger from 2022 through 2025, showing consistent year-over-year increases driven by bag fees, seat selection, bundled vacation products, and co-brand credit card remuneration.)
The co-brand credit card portfolio is the second pillar of Allegiant’s high-margin revenue mix.
The Allways Rewards Visa, issued through Bank of America, generated $33.3M in cobrand remuneration in just the second quarter of 2025, and the program ended that quarter with 20 million total active members on the rewards side.
The Allways Rewards Visa was also named the No. 1 “Best Airline Credit Card” in the USA TODAY 10Best 2025 Readers’ Choice awards, reinforcing the program’s brand strength among leisure travelers.
A third revenue driver, Allegiant Extra, is the premium seating product the company has been retrofitting across its Airbus A320 fleet.

The product offers seven inches of extra legroom, priority check-in and boarding, reserved overhead bin space, and a complimentary drink, with Allegiant targeting deployment on a substantial portion of the fleet by end of 2025.
Key Services and Products: Allegiant
The product portfolio remains intentionally narrow.
The core offering is point-to-point scheduled service at base fares typically less than half the average domestic round-trip ticket, with ancillaries layered on top.
The third bundled product offering, which Allegiant restored in late 2024, added more than $1 per passenger to ancillary revenue once the functionality was fully operational. This product packages baggage, seat selection, and priority services into a single up-sell at booking.
Allegiant also runs a fixed-fee contract business, generating $18.1 million of revenue in Q1 2026.
This segment includes military charters, sports team transportation, and other ad-hoc charter work that is now expected to grow meaningfully through Sun Country’s existing charter platform.

Sunseeker Resort Divestiture
A critical balance sheet event in 2025 was the divestiture of the troubled Sunseeker Resort in Charlotte Harbor, Florida.
Allegiant agreed to sell the property to Blackstone for $200 million in mid-2025, removing a multi-year drag on consolidated earnings and freeing management capacity to focus on the airline.
The resort had opened in December 2023 and never achieved sustained profitability, with hurricane disruption and weak ramp-up forcing repeated impairment charges.
The Blackstone transaction effectively closed that chapter and clarified Allegiant’s identity as a pure-play airline.