


Dear Readers, Welcome to AviationOutlook.
Let’s analyze the topic in detail.
Executive Summary
Largest U.S. regional airline by every meaningful metric. SkyWest ended Q1 2026 with 487 aircraft in scheduled service or under contract and a total operating fleet of 500 aircraft, connecting 261 destinations across 45 states and three countries.
Financial strength is back at a record level. Full-year 2025 revenue reached the highest in company history with $428 million in net income, up 33% YoY, and Q1 2026 carried the momentum forward with $1.01 billion in revenue and $2.50 diluted EPS.
Fleet is being repositioned, not just grown. SkyWest expects to surpass 300 Embraer E175 aircraft by year-end 2028 and convert single-class CRJ200s into 41-seat dual-class CRJ450s for United, with the first redesigned cabin entering service in Fall 2026.
Partner concentration is high, but contracts are extending. In January 2026, the company secured multi-year extensions for 40 E175s with United and 13 E175s with Delta, pushing committed flying well into the next decade.
Recommended - Read Full Reports


Read All Reports
Table of Contents
Executive Summary
SkyWest Company Profile: Key Facts
SkyWest Revenue and Financial Analysis
Revenue (Latest, In-Depth Picture)
Revenue Last Twelve Months (LTM)
Latest Quarterly Earnings Report and Guidance
Revenue Growth Drivers
Key Services and Product Mix
SkyWest Fleet Analysis
Fleet Size and Composition
Aircraft Type Strategy and Configuration
Fleet Age and Lifecycle
In-Depth Fleet Strategy
SkyWest Route Network Strategy and Major Destinations
Network Footprint at a Glance
Strategic Logic of the Network
Departures Mix by Partner
Essential Air Service and Small-Community Coverage
Cross-Border and Charter Flying
Major Operational Bases (Hubs)
The Eleven-Hub Network
Hub-by-Hub Strategic Role
Maintenance and Engineering Architecture
SkyWest Competitive Position
Major Competitors
SkyWest vs. Republic Airways
SkyWest vs. Envoy Air
SkyWest vs. Endeavor Air
SkyWest vs. PSA Airlines and Piedmont Airlines
SkyWest vs. GoJet, Air Wisconsin and CommutAir
Where SkyWest Wins, Where It Doesn’t
SkyWest Capital Structure, Liquidity and Capital Returns
SkyWest Partner-Level Operating Model: How the CPA Economics Work
Anatomy of a Capacity Purchase Agreement
Pilot Pipeline and Labor Strategy
SkyWest Charter (SWC): A Quiet New Growth Lever
Industry Backdrop: What 2026 Looks Like for U.S. Regionals
Strategic Initiatives Beyond 2026
Cabin Modernization Across the Fleet
Long-Range E175 Strategy
Investments in Adjacent Aviation Businesses
Operational Excellence: The Numbers Behind the Story
Completion Rate and Reliability
Passenger Volume and Load Factor
Block-Hour Productivity Curve
Key Risks (with Probability and Scenario Analysis)
Risk 1
Risk 2
Risk 3
Risk 4
Risk 5
Risk 6
Risk 7
Risk 8
Risk 9
Risk 10
Risk 11
Risk 12
Strategic Outlook for 2026 and Beyond
My Final Thoughts
Official Sources and Data
Introduction
SkyWest Airlines is the quiet giant of North American aviation.
While the four U.S. global carriers dominate headlines, more than 487 SkyWest jets fly under the brands of United Express, Delta Connection, American Eagle and Alaska SkyWest, carrying 46 million passengers in 2025 and operating out of 11 hubs.
In this 2026 in-depth report, you will see exactly how SkyWest converted a contract-flying model into $428 million in 2025 net income, why the new CRJ450 dual-class conversion matters for United, where its 270 E175s fit in a tight Scope-Clause world, and how the route map is shifting after the Republic-Mesa merger.
If your work touches regional capacity planning, fleet strategy, hub operations, pilot pipeline or partner-CPA economics, this is the analysis report you want bookmarked for 2026 and beyond.
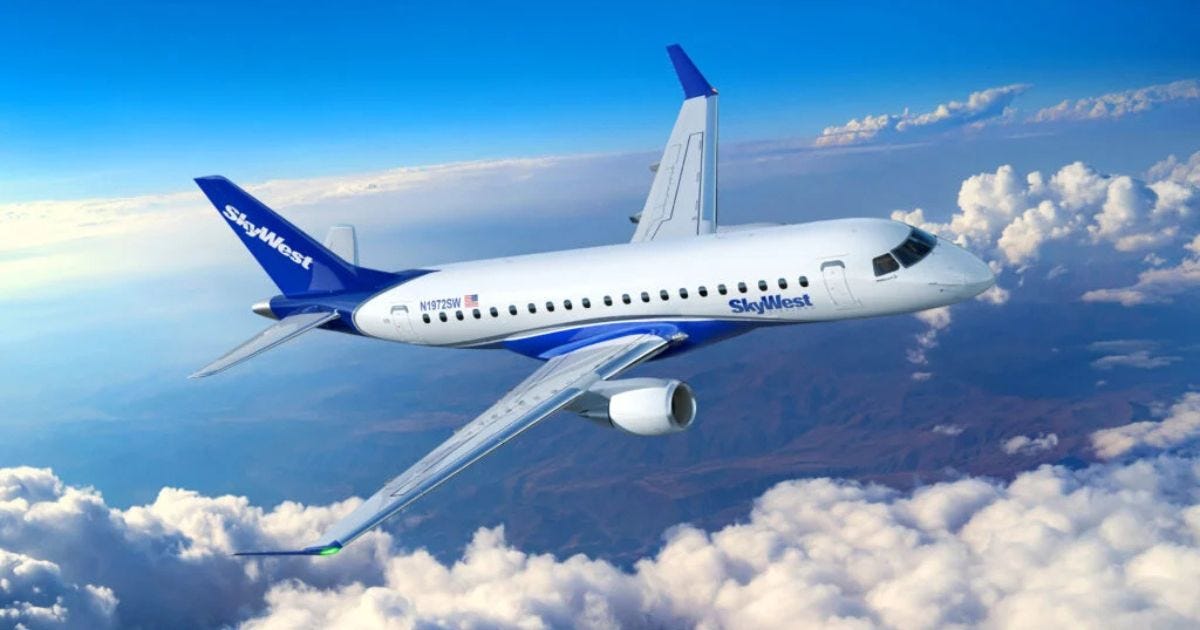
SkyWest Company Profile: Key Facts
SkyWest, Inc. is the holding company for three operating businesses: SkyWest Airlines (the regional jet operator), SkyWest Charter (SWC) and SkyWest Leasing.
The group is headquartered in St. George, Utah, and traces its first flight to June 19, 1972, when a single aircraft connected St. George (SGU) with Salt Lake City (SLC) via Cedar City (CDC).
By Q1 2026 the company employed 16,088 people (15,060 full-time equivalents) and operated 41% of its departures for United, 31% for Delta, 19% for American and 8% for Alaska.
SkyWest, Inc. — Key Facts (2026)
---------------------------------------------------------
Ticker / Exchange .............. SKYW / NASDAQ
Headquarters ................... St. George, Utah
CEO ............................ Chip Childs (President & CEO)
CFO ............................ Rob Simmons
CCO ............................ Wade Steel
Founded / First Flight ......... 1972 / June 19, 1972 (SGU–CDC–SLC)
Operating Subsidiaries ......... SkyWest Airlines, SkyWest Charter, SkyWest Leasing
Total Operating Fleet .......... 500 aircraft
Fleet in Service/Contract ...... 487 aircraft (Q1 2026 disclosure)
Destinations Served ............ 261 (45 states + DC + 6 Canadian provinces + 10 Mexican cities + 2 Bahamian islands)
Hubs ........................... 11 (ORD, DEN, DTW, IAH, LAX, MSP, PHX, PDX, SLC, SFO, SEA)
Crew Domiciles ................. 20
Maintenance Bases .............. 13
Employees ...................... 16,088 (15,060 FTE)
Passengers Carried (2025) ...... ~46 million
Q1 2026 Revenue ................ $1.013 billion
Q1 2026 Net Income ............. $102 million
Q1 2026 Diluted EPS ............ $2.50
Major Partners ................. United, Delta, American, Alaska
The corporate footprint is unusually wide for a regional carrier.
SkyWest maintains crew domiciles in 20 cities, maintenance bases in 13 locations, and line stations at 13 of its busiest stops, allowing the network to recover quickly from disruptions and rotate pilots through bases with the lowest commuting friction.
SkyWest Revenue and Financial Analysis
Revenue
SkyWest is one of the few U.S. airlines whose top line is driven primarily by fixed monthly capacity-purchase agreement (CPA) payments rather than ticket revenue. The model has rewarded shareholders handsomely as block-hour production has climbed.
Q1 2026 revenue came in at $1.013 billion, up 7% YoY from $948 million. Block-hour production rose 3% over the same period, reflecting higher fleet utilization and continued partner demand for regional lift.
For full-year 2025, SkyWest delivered the strongest profit year in its history, with pre-tax income of $566 million and net income of $428 million ($10.35 diluted EPS).
That represented a 33% YoY increase in net income on roughly 15% YoY block-hour growth.
Revenue Last Twelve Months (LTM)
On an LTM basis through Q1 2026, SkyWest’s revenue stack approximates $4.13 billion when stitching the four most recent quarters (Q2 2025 $1.04B + Q3 2025 $1.05B + Q4 2025 $1.02B + Q1 2026 $1.01B).
The trajectory rests on a structurally simple foundation: more aircraft flying more block hours under contracts that already exist.
The deferred-revenue pool is the underappreciated cushion in the model.
As of March 31, 2026, cumulative deferred revenue stood at $240.7 million, representing fixed CPA cash already received but not yet recognized in earnings.
Latest Quarterly Earnings Report and Guidance
CEO Chip Childs framed the Q1 2026 print as a continuation of the playbook rather than a pivot.
Operating expenses rose 10% YoY to $889 million in Q1 2026, driven mostly by higher production volumes and elevated pilot training costs as new-hires complete type ratings on E175 and CRJ equipment.
SkyWest, Inc. — Q1 2026 Financial Highlights
--------------------------------------------
Revenue ......................... $1,013 million (+7% YoY)
Operating Expenses .............. $889 million (+10% YoY)
Pre-tax Income .................. $108 million
Net Income ...................... $102 million (vs. $101M in Q1 2025)
Diluted EPS ..................... $2.50 (vs. $2.42 in Q1 2025)
Cash & Marketable Securities .... $627 million (Mar 31, 2026)
Total Debt ...................... $2.4 billion (flat vs. Dec 31, 2025)
Block Hours ..................... 362,933 (+3% YoY)
Departures ...................... 204,019
Passengers Carried .............. 10.33 million
Adjusted Flight Completion ...... 99.9%
Passenger Load Factor ........... 78.0%
Share Repurchases (Q1 2026) ..... 783,000 shares for $75M ($96.18 avg)
The Q3 2025 transcript noted that contractual flying capacity is expected to be roughly flat to modestly up in 2026, as incremental E175 and CRJ550 additions replace retiring CRJ200s and other older aircraft.
Revenue Growth Drivers
The growth recipe is becoming clearer with every release. First,