


Executive Summary
Virgin Australia returned to the Australian Securities Exchange on 24 June 2025 at A$2.90 per share, raising A$685 million in one of the most-watched Australian listings in years and ending five years of Bain Capital majority private ownership of Virgin Australia.
The carrier posted pro forma underlying NPAT of A$331 million in FY25 (year ended 30 June 2025), up 27.8% year-on-year, and followed with 1HFY26 underlying EBIT of A$490 million, up 11.7% on 1HFY25, with revenue of A$3.32 billion.
The fleet now exceeds 105 aircraft across the mainline Boeing 737NG and 737 MAX 8 platform plus regional Embraer E190-E2, A320 and Fokker 100 jets, with a long-running narrowbody renewal program built around 33 confirmed 737 MAX aircraft on order or in service.
Virgin Australia has overtaken Qantas to claim the largest domestic market share (33.2%, with the duopoly, considering Qantas Group with Jetstar, holding 98.8% of the domestic market in early 2026).
Meanwhile, the long-haul Doha service operated under a Qatar Airways wet-lease frames a multi-year decision on whether to bring widebodies back in-house.
Recommended - Read Full Reports


Read All Reports
Table of Contents
Executive Summary
Virgin Australia Company Profile: Key Facts
Virgin Australia Revenue and Financial Analysis
FY25 Full Year Results: The Final Pre-IPO Year
1HFY26 Interim Results: Momentum Continues
FY26 Guidance and Capacity Outlook
Revenue Growth Drivers
Key Services and Products
Virgin Australia Fleet Analysis
Fleet Size and Composition
Average Fleet Age and Renewal
Aircraft Types Strategy and Configuration
Boeing 737 MAX Order Book
Widebody Question
Fleet Strategy Beyond 2026
Virgin Australia Route Network Strategy and Major Destinations
Domestic Network: The Strategic Core
International Network: Selective Expansion
Doha and the Qatar Airways Wet Lease
Regional Network: VARA and Charter Flying
Route Network Strategy: The Three Pillars
Major Operational Bases (Hubs)
Brisbane: The Operational Headquarters
Sydney: Corporate and International Gateway
Melbourne: Southern Gateway
Perth: Regional Headquarters
Virgin Australia Competitive Position
Major Competitors
Virgin Australia vs Qantas: The Duopoly Battle
Virgin Australia vs Jetstar
Virgin Australia vs Rex
Virgin Australia vs Air New Zealand
Virgin Australia vs Singapore Airlines
Velocity Frequent Flyer: A Strategic Profit Engine
Program Redesign October 2025
Loyalty Economics
Sustainability and Sustainable Aviation Fuel
Ownership Structure and IPO Listing
The Bain Capital Era
Qatar Airways 25% Stake
IPO and Public Listing
Cargo and Charter Operations
Codeshare and Alliance Strategy
Key Risks: With Probability and Scenario Analysis
Risk 1
Risk 2
Risk 3
Risk 4
Risk 5
Risk 6
Risk 7
Risk 8
Risk 9
Risk 10
Strategic Outlook: Virgin Australia Beyond 2026
My Final Thoughts
Official Sources and Data
Virgin Australia Company Profile: Key Facts
Virgin Australia Holdings Limited is a Brisbane-headquartered full-service airline group that traces its operating heritage to Virgin Blue’s 2000 launch as Australia’s first low-cost airline.
After voluntary administration in April 2020 and a private equity-led restructuring under Bain Capital, the group repositioned around a mid-market full-service offering with a Boeing 737-centric fleet.
The company is now publicly traded under ASX ticker VGN. Qatar Airways Group acquired a 25% equity interest from Bain Capital in 2025 after Australian Treasurer approval, embedding the airline into a wider global network strategy. Bain Capital remains a substantial shareholder following the IPO.
Company name:        Virgin Australia Holdings Limited
ASX ticker:          VGN
Listing date:        24 June 2025
Headquarters:        South Bank, Brisbane, Queensland
Operating hubs:      Brisbane (BNE), Melbourne (MEL), Sydney (SYD)
CEO:                 Dave Emerson (appointed March 2025)
Group passengers:    20.7 million (FY25)
Mainline fleet:      ~99 Boeing 737NG and 737-8 aircraft
Regional fleet:      6+ aircraft (VARA) including E190-E2
Network:             ~33 domestic + 6 international destinations
Velocity members:    Over 13 million (loyalty program)
Founded:             August 2000 (as Virgin Blue)
Dave Emerson assumed the chief executive role on 27 March 2025, succeeding Jayne Hrdlicka after his prior tenure as Chief Commercial Officer. The appointment of Emerson coincided with the prospectus drafting work, giving the relisting a continuity-of-strategy narrative for the market.
The Virgin brand is licensed from the Virgin Group founded by Sir Richard Branson, which retains a minority strategic shareholding. The group operates two reportable segments: Virgin Australia Airlines (passenger flying, cargo and Virgin Australia Regional Airlines) and Velocity (the frequent flyer loyalty business).
The corporate restructure that emerged from administration in late 2020 deliberately simplified the airline into a single-jet-family operation.
This concentrated mainline flying on the Boeing 737 platform, eliminating the cost overheads associated with the previous A330, Boeing 777-300ER, and ATR 72 sub-fleets the carrier had operated under prior leadership.
Virgin Australia Revenue and Financial Analysis
FY25 Full Year Results: The Final Pre-IPO Year
Virgin Australia’s FY25 reporting period covers the 12 months to 30 June 2025, the final results released before the relisting closed in late June. The headline pro forma underlying NPAT figure was A$331 million, representing year-on-year growth of 27.8% versus FY24.
Statutory net profit after tax came in at A$478.5 million. This was lower than the A$545.4 million result in FY24, but the FY24 base was inflated by a series of significant items reversing prior years’ accounting estimates. The pro forma underlying number is therefore the more useful operating performance metric.
The financial picture combined disciplined cost recovery with strong loyalty earnings. The Velocity segment posted double digit revenue growth, while the Airlines segment captured the benefit of higher load factors and improved passenger mix.
Total group revenue for FY25 stood at A$5.8 billion, an increase of 3.1% on FY24. Total operating expenses rose at a faster pace of 8.8%, reflecting both reinvestment in operations and the inflationary pressure across labour, navigation services and ground handling that all Australian carriers absorbed during the year.
FY25 GROUP RESULT HIGHLIGHTS
Pro forma underlying NPAT:    A$331m (+27.8% vs FY24)
Statutory NPAT:               A$478.5m (vs A$545.4m FY24)
Group revenue:                A$5.8 billion (+3.1%)
Passengers carried:           20.7 million (vs 19.2m FY24)
Load factor (VA Airlines):    84.9% (+1.9 ppts on FY24)
RASK:                         16.53 cents/ASK (+4.0%)
CASK ex-fuel:                 +6.6% vs FY24
The 84.9% load factor across the Boeing 737 mainline operation reflected solid leisure demand, particularly through the southern hemisphere summer peak, supplemented by gradually recovering corporate volumes through the second half.
Domestic capacity discipline by both Qantas and Virgin Australia underpinned the yield environment.

Cost per available seat kilometre excluding fuel rose 6.6% on FY24. Management attributed this to higher engineering input costs, wage indexation and a deliberate decision to insource ramp handling at three major airports.
While this elevated near-term unit costs, the strategic logic centred on operational reliability and on-time performance gains.
1HFY26 Interim Results: Momentum Continues
The half year to 31 December 2025 marked Virgin Australia’s first interim result as a re-listed entity. The carrier reported revenue of A$3.32 billion, up 9.3% on the prior corresponding period, with underlying EBIT climbing 11.7% to A$490 million.
Underlying NPAT rose 20.7% to A$279 million in 1HFY26, and the EBIT margin expanded to 14.8%, a 30 basis point improvement on the prior period. The Airlines segment specifically delivered underlying EBIT of A$419 million, up 13.5% year on year, with margin expansion of 40 basis points to 13.1%.
1HFY26 RESULTS (Half year to 31 Dec 2025)
Revenue:                A$3.32 billion (+9.3%)
Underlying EBIT:        A$490m (+11.7%)
Underlying NPAT:        A$279m (+20.7%)
Group EBIT margin:      14.8% (+30 bps)
Airlines segment EBIT:  A$419m (+13.5%)
The interim result was framed by management against a backdrop of moderating fuel prices in the first quarter and steady premium leisure demand into Bali, Queenstown and Fiji over the Australian school holidays.
The Velocity loyalty segment continued to grow points liability balances faster than redemptions, indicating both stronger acquisition and persistent member engagement.
FY26 Guidance and Capacity Outlook
In April 2026, Virgin Australia updated its full year guidance after a meaningful jet fuel cost spike that affected the second half. RASK growth for the second half was upgraded to approximately 5%, compared to prior guidance of 3% to 4%, with fourth quarter RASK expected near 6%.
The carrier simultaneously trimmed total domestic capacity for the June quarter, switching to a 1% capacity decrease versus the previously guided 2% to 3% growth. The disciplined posture was designed to protect yield in the face of softer business demand from energy-intensive corporate accounts.
CEO Dave Emerson confirmed the company maintained earnings forecasts for the full year. IPO-mandated hedging programs offset a material portion of the jet fuel headwind, and ancillary revenue per passenger grew sequentially through the second half.
Revenue Growth Drivers
The revenue engine running underneath Virgin Australia’s FY25 and 1HFY26 performance rests on several layered drivers.
First, RASK growth of 4% across FY25 reflected the carrier’s ability to capture higher fare gains while increasing load factors close to a historical sweet spot in the mid-80s.
Second, ancillary revenue growth has materially outpaced ticket revenue growth. The unbundling of seat selection, bag and premium economy upsell categories, combined with credit card partnerships through Velocity, has transformed the per-passenger revenue equation versus the pre-administration cost structure.
Third, the loyalty program has become a major standalone profit centre. Velocity’s earned revenue from card partner spend, marketing partnerships and third-party redemptions provides a high-margin annuity stream that smoothes the cyclicality of pure flying revenue.
Fourth, the international Doha wet-lease, while contributing modestly in revenue terms, has anchored a multi-stop sales narrative through Velocity to over 600 connecting destinations served by Qatar Airways and partner carriers.
Key Services and Products
The core product offering centres on three domestic cabin tiers. Economy seating dominates the Boeing 737 cabin layout, supplemented by a business class section featuring recliner seats with extended pitch on routes between mainland capital cities and Perth.
Economy X, the premium economy product, occupies the forward economy rows behind business class. The cabin provides additional legroom, priority boarding, and front-row exit access. This product has been the primary upsell vector in recent years and contributes meaningfully to RASK uplift on transcontinental sectors.
Cargo services operate as a structured wholesale business across the domestic 737 belly capacity and overnight freighter charters. Charter operations through VARA serve the Western Australian resources sector with dedicated fly-in fly-out programs for mining and energy clients.
PRODUCT PORTFOLIO
1. Economy class           (standard Boeing 737 seating)
2. Economy X               (premium economy row product)
3. Business class          (front cabin recliner seats)
4. Velocity Frequent Flyer (loyalty / co-brand cards)
5. Virgin Australia Cargo  (belly + dedicated capacity)
6. VARA Charter            (FIFO mining and resource flying)
7. Holiday packages        (flight + accommodation bundling)
The Velocity Frequent Flyer program reaches well over 13 million members and underwent a substantial program redesign from 1 October 2025.
The introduction of the Forever Gold tier rewards long-term loyalty, while changes to status credit accrual placed a 50% earn minimum requirement on Virgin Australia metal versus partner-operated flights.
Virgin Australia Fleet Analysis
Fleet Size and Composition
Virgin Australia operates a fleet that exceeds 105 aircraft when counting the mainline carrier and regional subsidiary together.
The official fleet page lists more than 94 mainline aircraft as at 1 May 2026, with the figure rising as additional Boeing 737-8 deliveries arrive through the second half of FY26.


The mainline operation is built around three Boeing 737 sub-types plus a small fleet of Embraer E190-E2 aircraft assigned to the regional subsidiary. The strategic choice to standardise on the 737 platform reflects efficiency targets around crew training, spares pooling, line maintenance and gate utilisation.
FLEET COMPOSITION (as at 1 May 2026)

Mainline (Virgin Australia):
- Boeing 737-8 (MAX 8):       ~8 in service (rising during FY26)
- Boeing 737-800:             ~75 aircraft (workhorse fleet)
- Boeing 737-700:             Small remaining sub-fleet
- Total mainline:             ~94+ aircraft

Regional (VARA):
- Embraer E190-E2:            Initial deliveries from late 2025
- Fokker 100 (F100):          Western Australia charter
- Airbus A320:                Charter operations

Group total:                  100+ aircraft operating
The Boeing 737-800 is the absolute workhorse, with approximately 75 frames forming the spine of the domestic and short-haul international network.
These are progressively being inducted into a A$110 million interior refresh program bringing in-seat power, new seat foams and refreshed cabin trims to harmonise the experience with the incoming 737 MAX 8.
The 737-700 sub-fleet plays a marginal role and trends toward retirement as MAX deliveries arrive. The smaller-gauge frames are useful for thinner routes and off-peak rotations, but the long-term direction points to an all 737-800 plus 737-8 mainline by the end of the decade.
Average Fleet Age and Renewal
Average fleet age across the mainline operation sits at approximately 12 years according to public aircraft databases. This makes the carrier’s fleet noticeably older than peers like Air New Zealand, but in line with mature global mid-market full-service airlines.
The age statistic is also being progressively pulled younger as deliveries of brand new 737 MAX 8 frames replace older 737-800 hulls.
Each MAX 8 entering service displaces an older NG airframe in capacity terms, refreshing the customer experience while delivering double-digit fuel burn reductions per seat.
Aircraft Types Strategy and Configuration
The Boeing 737-800 carries 176 passengers in a typical Virgin Australia layout of eight business class recliner seats and 168 economy seats including Economy X rows. The cabin refresh underway extends the asset life of these aircraft and ensures consistent product across the fleet during the multi-year MAX transition.
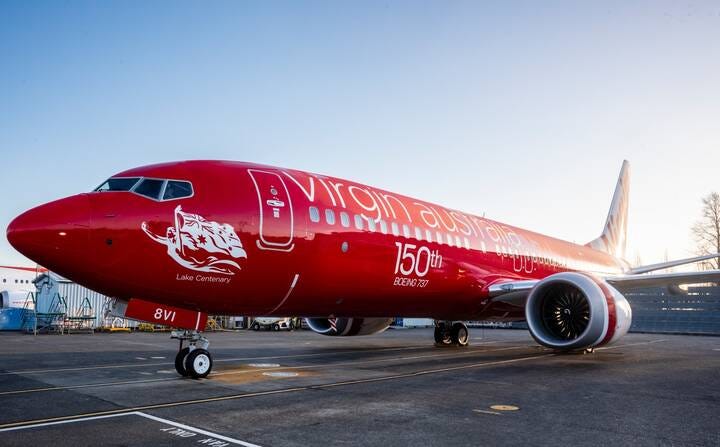
The Boeing 737-8 (MAX 8) is configured similarly with refreshed interiors, mood lighting, USB power at every seat, and Boeing Sky Interior overhead bins. The improved cabin doubles as a marketing differentiator domestically and on Pacific routes.
The MAX 8 burns approximately 14% to 15% less fuel per seat than the 737-800 it replaces, depending on stage length and engine derate. On a domestic transcontinental sector such as Brisbane to Perth, that improvement is materially meaningful for both unit cost and the carbon emissions trajectory.
The Embraer E190-E2 is configured in a dual class layout with business class up front and economy in the main cabin. The first aircraft entered scheduled service with VARA on 27 October 2025, flying between Perth and Boolgeeda for charter passengers.
Boeing 737 MAX Order Book
The order book provides multi-year fleet visibility. As of recent disclosures the airline has an eight 737-8 MAX operating, with additional aircraft scheduled through FY26, and a further pipeline including 737-10 commitments stretching well into the second half of the decade.
In 2025 Virgin Australia converted 12 of its 737-10 MAX orders to 737-8s. This conversion responded to Boeing certification delays on the larger 737-10 variant and provided earlier capacity certainty for the network plan.
The strategic logic is to add capacity in a more reliable timeline rather than wait years for the 737-10 to complete certification. Once the 737-10 enters service with the carrier, its higher seat count will be best deployed on capacity-constrained slot-restricted routes such as Sydney to Melbourne.
BOEING 737 MAX ORDER BOOK STRATEGY

Variant      | Approx commitment | Status
-------------|-------------------|-------------------
737-8 MAX    | ~14 firm          | Deliveries underway
737-10 MAX   | ~10+ firm         | Awaiting certification
Conversion   | 12 from -10 to -8 | Confirmed 2025
Total MAX    | ~33 program       | Multi-year rollout
The carrier expects to receive 13 Boeing 737-8 aircraft during fiscal 2026, with these arrivals representing the largest single-year fleet refresh in the company’s history. Delivery confidence improved after Boeing’s manufacturing stabilisation post-2024 quality issues.
Widebody Question
Whether Virgin Australia will reintroduce widebody aircraft into its own fleet is the most significant strategic open question of the decade. Currently long-haul flying to Doha is operated under a wet-lease arrangement with Qatar Airways using Qatar-supplied aircraft, crew, maintenance and insurance.
CEO Dave Emerson has signalled the carrier will consider widebody orders, but only after meaningful data is gathered from the wet-leased Doha operation. Any decision is likely to be years away given the runway needed to evaluate route profitability and pilot training pipelines.
A widebody return would mark a strategic departure from the Bain Capital playbook that explicitly retired the previous A330 and 777-300ER widebodies in 2020. The decision criteria will weigh capital intensity, ROIC dilution and crew complexity against the strategic value of owning long-haul flying outright.
Fleet Strategy Beyond 2026
Beyond 2026 the fleet narrative centres on three threads.
First, complete the 737 MAX renewal on the mainline.
Second, scale the E190-E2 regional fleet to provide a true network gauge between the 737-800 and turboprop competitors.
Third, decide on widebodies based on long-haul performance evidence.
The mainline standardisation strategy carries a meaningful long-term cost benefit. Single-fleet airlines historically achieve unit cost advantages of 5% to 10% versus more complex peers through simplified maintenance, training, and spares programs.